Measurements
Measurement is the set of periods to be compared. In the case of Netstorm, Test run is also termed as measurement.
Preset is the period of one entity for the comparison. There are following options within Preset:
- Live: It is to compare live data. For example – Last 5 minutes, Last 10 minutes, Last 30 minutes, Last 1 hour, Last 2 hours, Last 4 hours, Last 6 hours, Last 8 hours, Last 12 hours, Last 24 hours.
- Past: It is to compare past data. For example – Yesterday, Last week, Last 2 weeks, Last 2 months, Last year.
- Events: It is to compare data for some specific events. For example – Black Friday, Christmas Day, Good Friday, Cyber Monday etc.
- Whole Scenario: It is used to compare data for whole scenario.
- Time Back: In time back, we can compare the data on: Hourly, Daily, Weekly and Monthly basis.
Note: Starts at and Ends at options are enabled where you can fill the start & end date and time of the measurement. It is enabled when you do not select the Preset option. In the case of NetStorm, two options are displayed on selecting Custom – Absolute and Elapsed. In the case of Absolute, enter Start Date, Start Time, End Date and End Time. The specified date/time should be in range with the current session.
Starts at
It is used to specify the start time to execute the compare.
Ends at
It is used to specify the end time for executing the compare.
Name
It is used to specify the name of the preset.
Update
It is used to update the details (in the left panel), by clicking on the Update button.
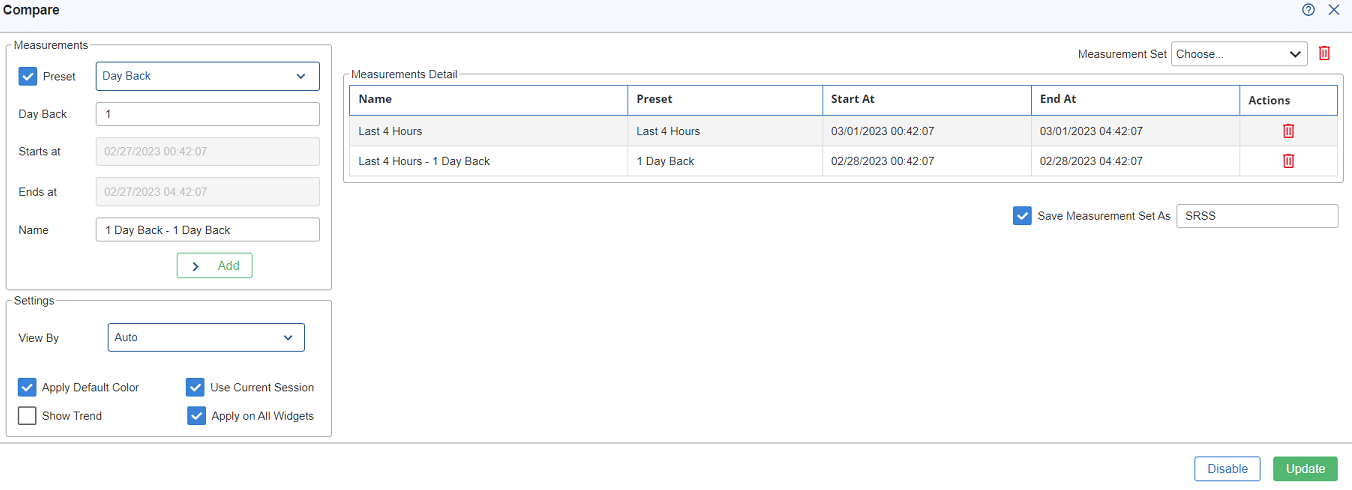
Measurements Details
In measurement details, there are the following fields which are listed below:
- Name: It is a unique name, which is assigned for the particular measurement. Auto suggestions for measurement names are provided based on the start and end time of the measurement, Day & current session.
- Preset: It is the period of one entity for the comparison.
- Start at: It is the start time of the measurement.
- End at: It is the end time of the measurement.
- Action: It is used to delete a measurement from the table.
Note: If a user wants to save the measurement details, they need to click on the Save Measurements As checkbox.
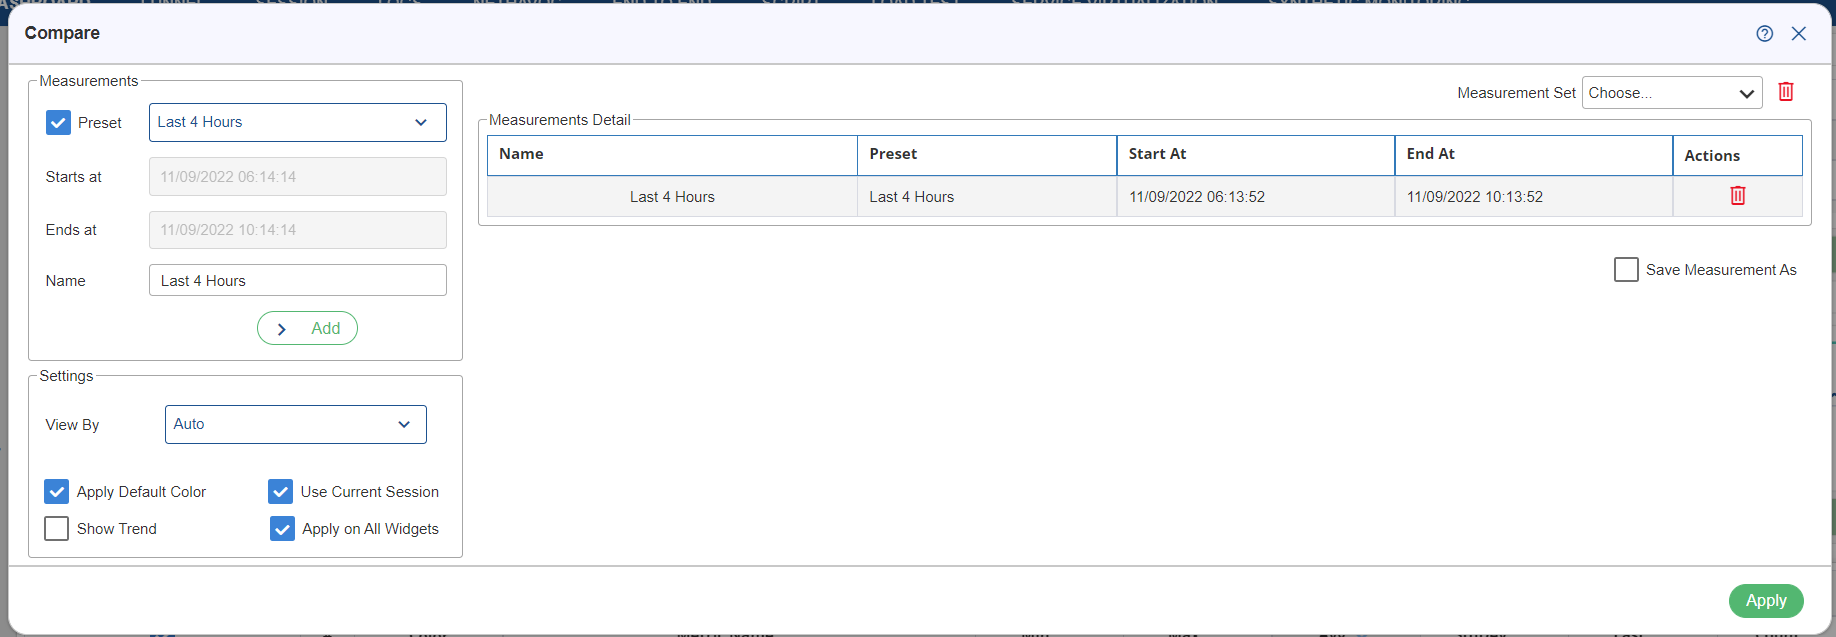
Settings
In settings option, user can set the following options:
- View By: You can set a sample interval in graphs for comparison by changing the unit & value in the View by & View by Value option. View by contains the following options:
- Auto: It is used to select sample intervals automatically as per duration of compared measurements.
- Second: It contains the values, such as 10 Sec, 20 Sec, 30 Sec, 40 Sec & 50 Sec.
- Minute: It contains the values, such as 1 Min, 2 Min, 4 Min, 5 Min, 10 Min, 15 Min & 30 Min.
- Use Current Session: User can add the default dashboard as baseline measurement by checking Include default dashboard as baseline checkbox given in the right pane of the compare dialog box.
- Show Trend: To enable compare for trend compare. You can compare the value of a single metric at multiple events or in multiple measurements in the form of connected trend graphs. On clicking Show Trend, the color option is not visible.
- Apply on All Widgets: User can apply to compare all widgets of the Dashboard or active one. If this check box will be checked then compare will apply to all widgets otherwise only the active widget.
- Apply Default Color: To apply default color on all the widgets.
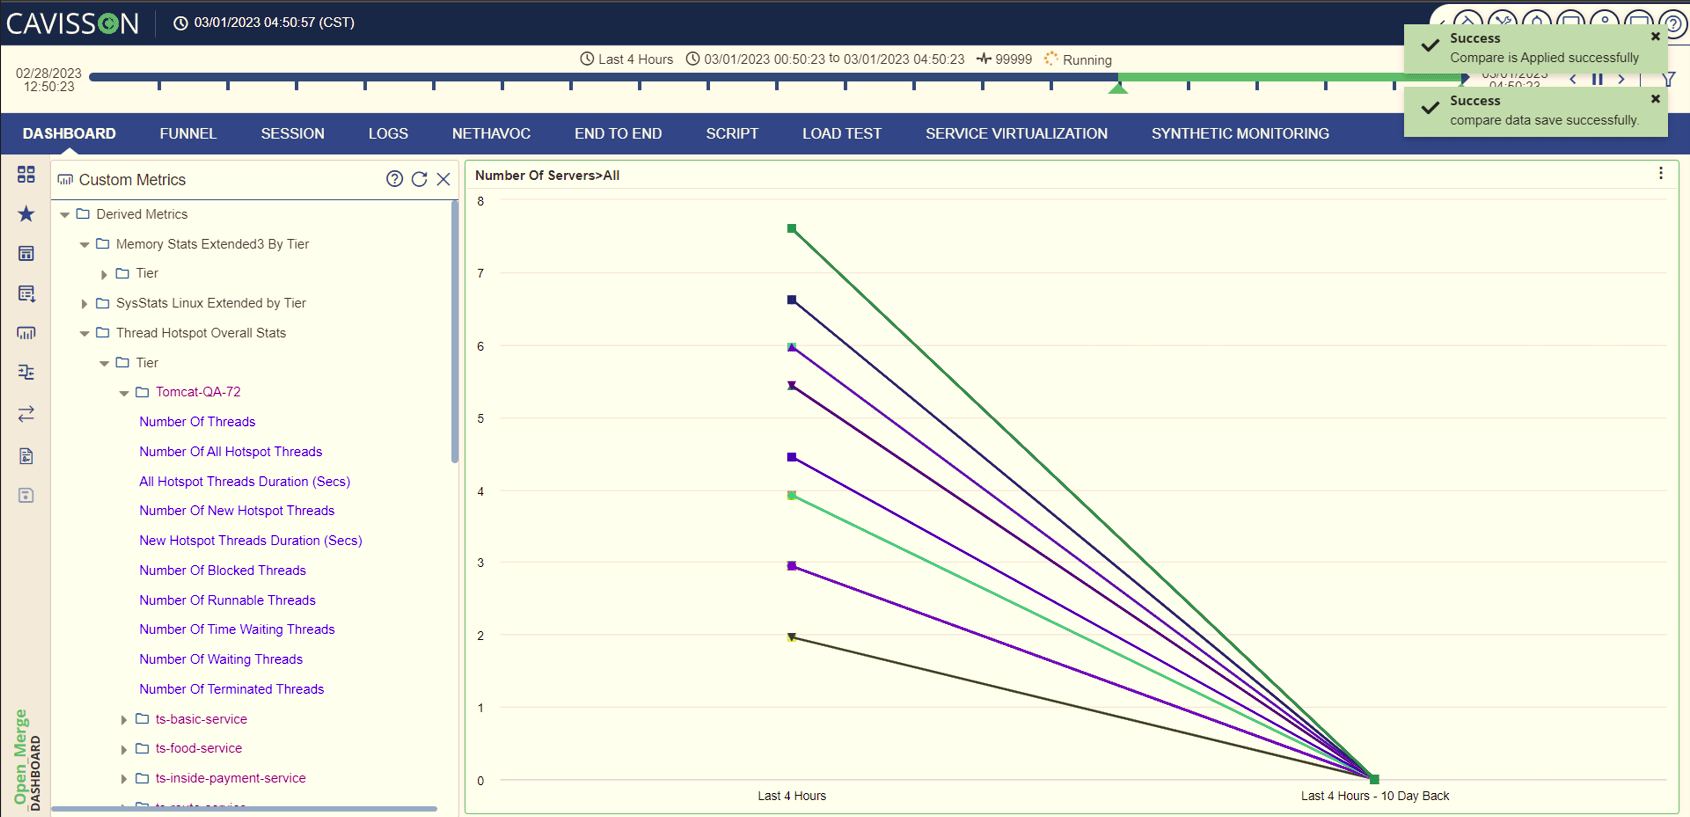
Applying Compare
Once the required number of measurements are added in the right panel of the compare dialog box, you can apply comparison by clicking the Apply ![]() button in the right pane of the compare dialog box.
button in the right pane of the compare dialog box.


Sync point is released due to following reasons.
- Release Target Vusers Arrive at the Sync Point: When target Vusers arrive at the Sync point, then they are released.
- Overall Timeout: Maximum time allowed for each Sync point to reach the target after first Vuser has entered the system. If the Sync point is not released within the timeout period, then all the Vusers are released from the Sync point.
- Inter User Arrival Timeout: Maximum time allowed between two Vusers arriving at a Sync point.
- Manual Release: Immediate release for any Sync point at any state (by using the ‘Release’ button).
- Multiple release policy: A set of Vusers is released at an absolute time in step mode, and another set of Vusers will be released periodically with the same step mode (a + b).
- Single release policy: Allows you to configure the percentage of Vusers to be released in a particular duration.
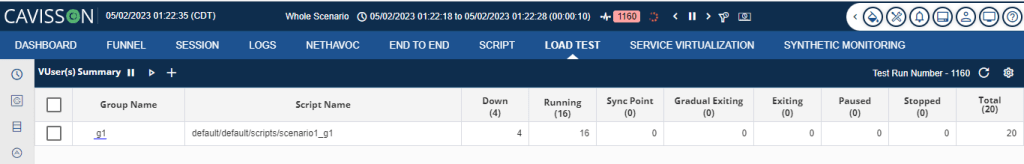
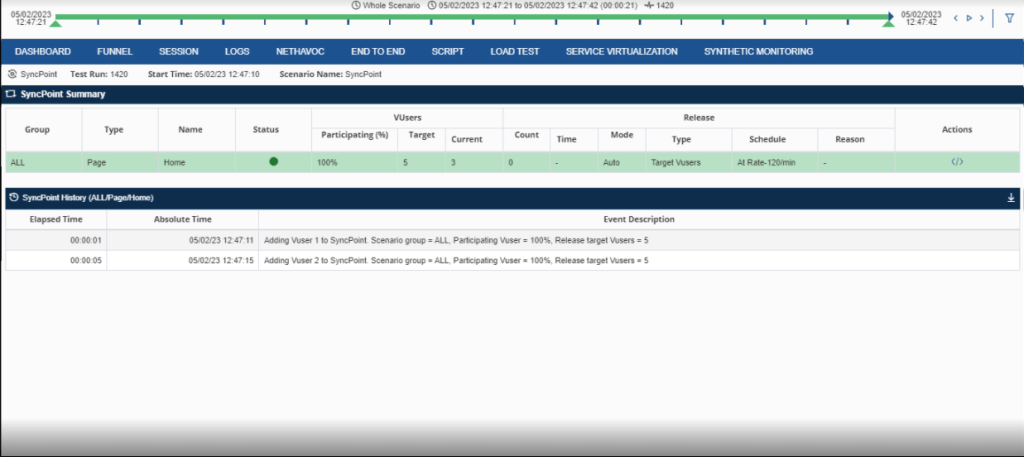
It has the following fields in Sync Point Summary:
- Group Name: It shows the name of the group.
- Type: Specify the type of sync point.
- Name: Specify the name of the object (transaction/page/script/custom) on which SyncPoint is applied.
- Participating Vusers%: Percentage of Vusers participated for a specific Sync point. This percentage is calculated over the total number of Vusers in the case of ALL groups.
- Release Target Vusers: Specifies the number of Vusers that should reach a Sync point for releasing that Sync point.
- Action: To add, release, update, delete, activate or deactivate the Sync point.
- Mode: It is the way in which the Sync point is going to be released. This could be done either automatically or manually.
- Release Type: It shows how the Vusers will be released
- Schedule: It defines when the VUsers are released after they have reached their respective Sync point.
- Last Release Reason: Reason for the last release of Sync point. If the release happens multiple times, the reason gets overwritten each time and it displays the latest one. There can be the following reasons:
- Target Reached
- Period Completed
- Absolute Time Completed
- Status
![]() – Activated Sync point
– Activated Sync point
![]() – Deactivated Sync point
– Deactivated Sync point
![]() – Sync point in Progress [All action buttons are disabled for Sync point with this status]
– Sync point in Progress [All action buttons are disabled for Sync point with this status]
A user can view the history of a Sync point by selecting it from the Sync Point(s) Summary table. It displays elapsed time, absolute time, and event description.
- Elapsed time: Elapsed time is simply the amount of time that passes from the beginning of an event to its end. For example, 00:00:02, 00:00:07, and so on.
- Absolute Time: Absolute time is simply the actual time of the occurrence of the event. For example, 09/04/19 22:25:27, 09/04/19 22:25:32, and so on. The format of absolute time is: MM/DD/YY HH:MM: SS.
- Event Description: Events get generated on every user arrival and on every Sync point release. Only one event for user arrival is logged within 10 seconds. All events for Sync Points release are logged in the system and are displayed on the Sync Point History

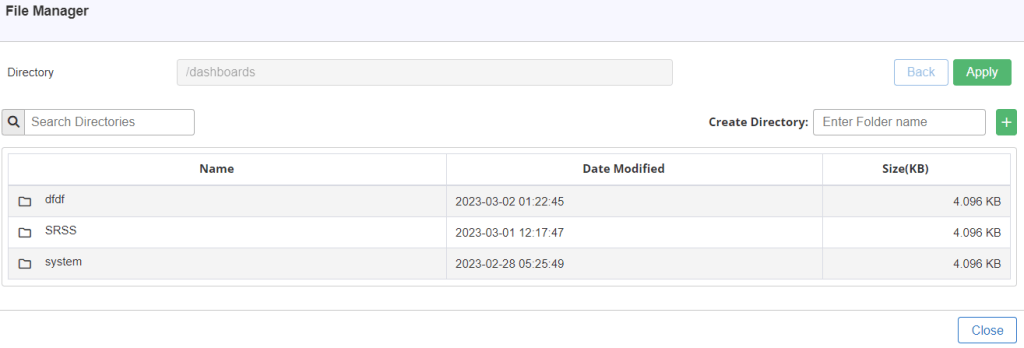
8. In the file manager window, create a directory by entering the folder name in the Create Directory
Notes:
- On entering the directory name in the Create Directory field, click on the Add
 button to add the directory.
 - Once you click on the add button, the directory will be created and will be displayed in the File Manager window as shown in below figure.
- You can click on the Back
 button to go back to the File Manager
 - You can click on the Apply
 button, to use the selected directory for the new dashboard.
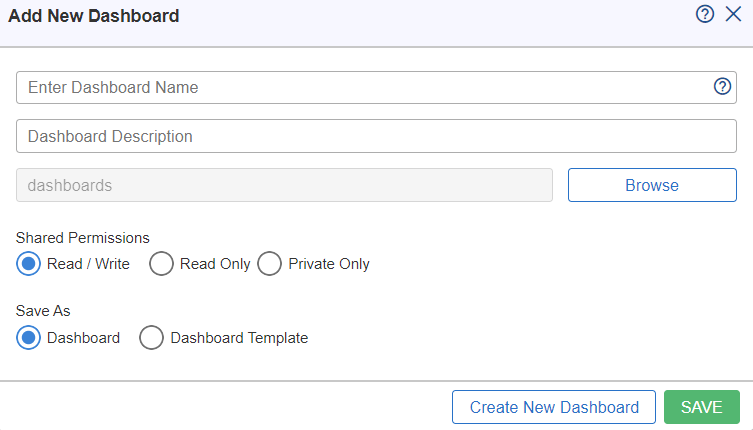
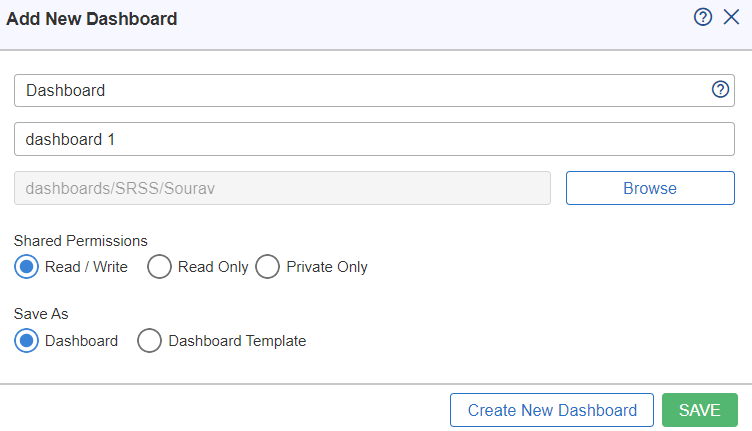
On clicking the Apply button, the selected directory with its path will be displayed on the Add New Dashboard window as shown in below figure.
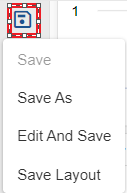
Select the Save ![]() option to save the dashboard as shown in below figure.
option to save the dashboard as shown in below figure.

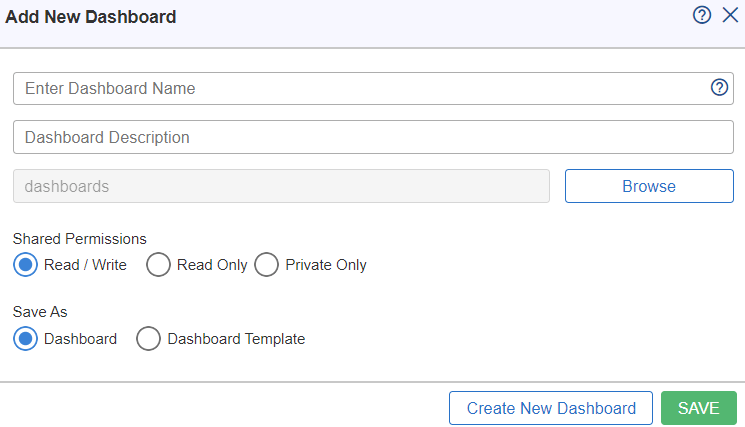
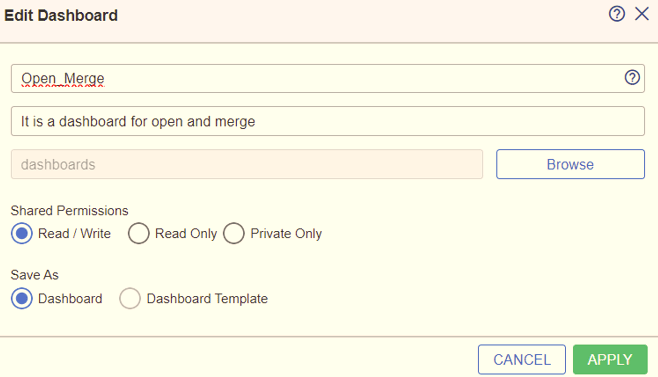
In the add new dashboard window, enter the dashboard name and description for the new dashboard, select the required shared permission option such as: Read/Write, Read Only and Private Only.
Note: You can also provide the path on which the new dashboard is to be added. To select the path, click on the Browse ![]() button.
button.
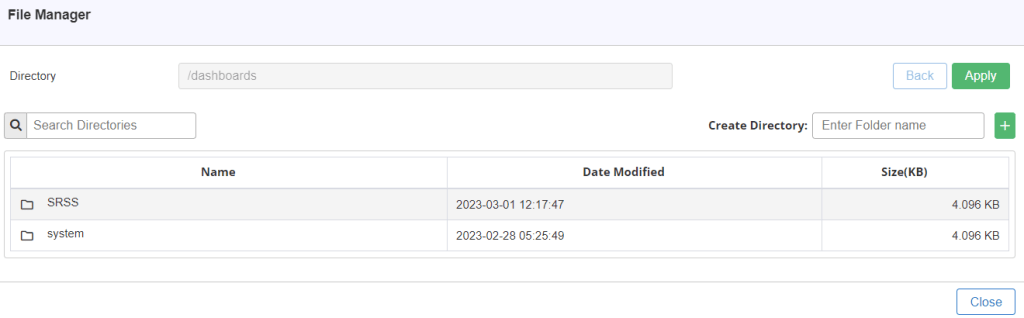
On clicking the browse button, the File Manager window will appear as shown in below Figure 143.

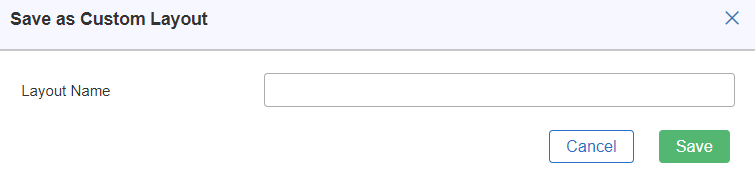
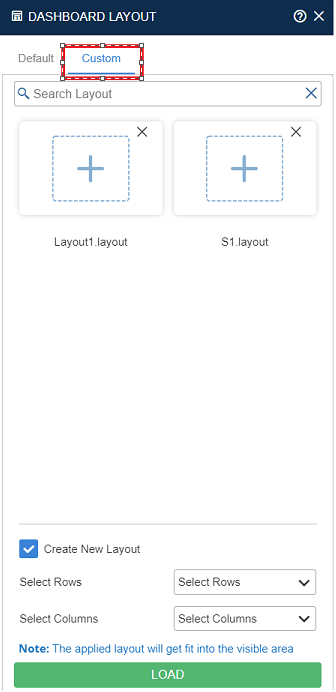
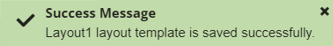
You have to enter the name for the layout in the Layout Name field, and then click on Save ![]() button. A success message is displayed at the top right corner of the window, as shown in below Figure 146.
button. A success message is displayed at the top right corner of the window, as shown in below Figure 146.
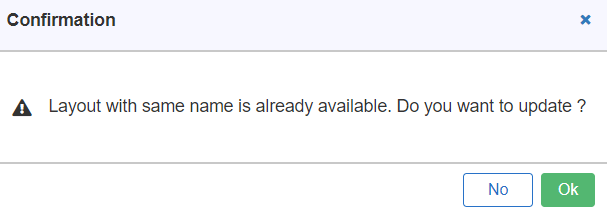
Note: When you try to save a layout with an existing name, an alert message is displayed stating Layout with same name is already available. Do you want to update? Click on OK ![]() button, to update the layout. If you don’t want to update the layout, then click on No
button, to update the layout. If you don’t want to update the layout, then click on No ![]() button.
button.